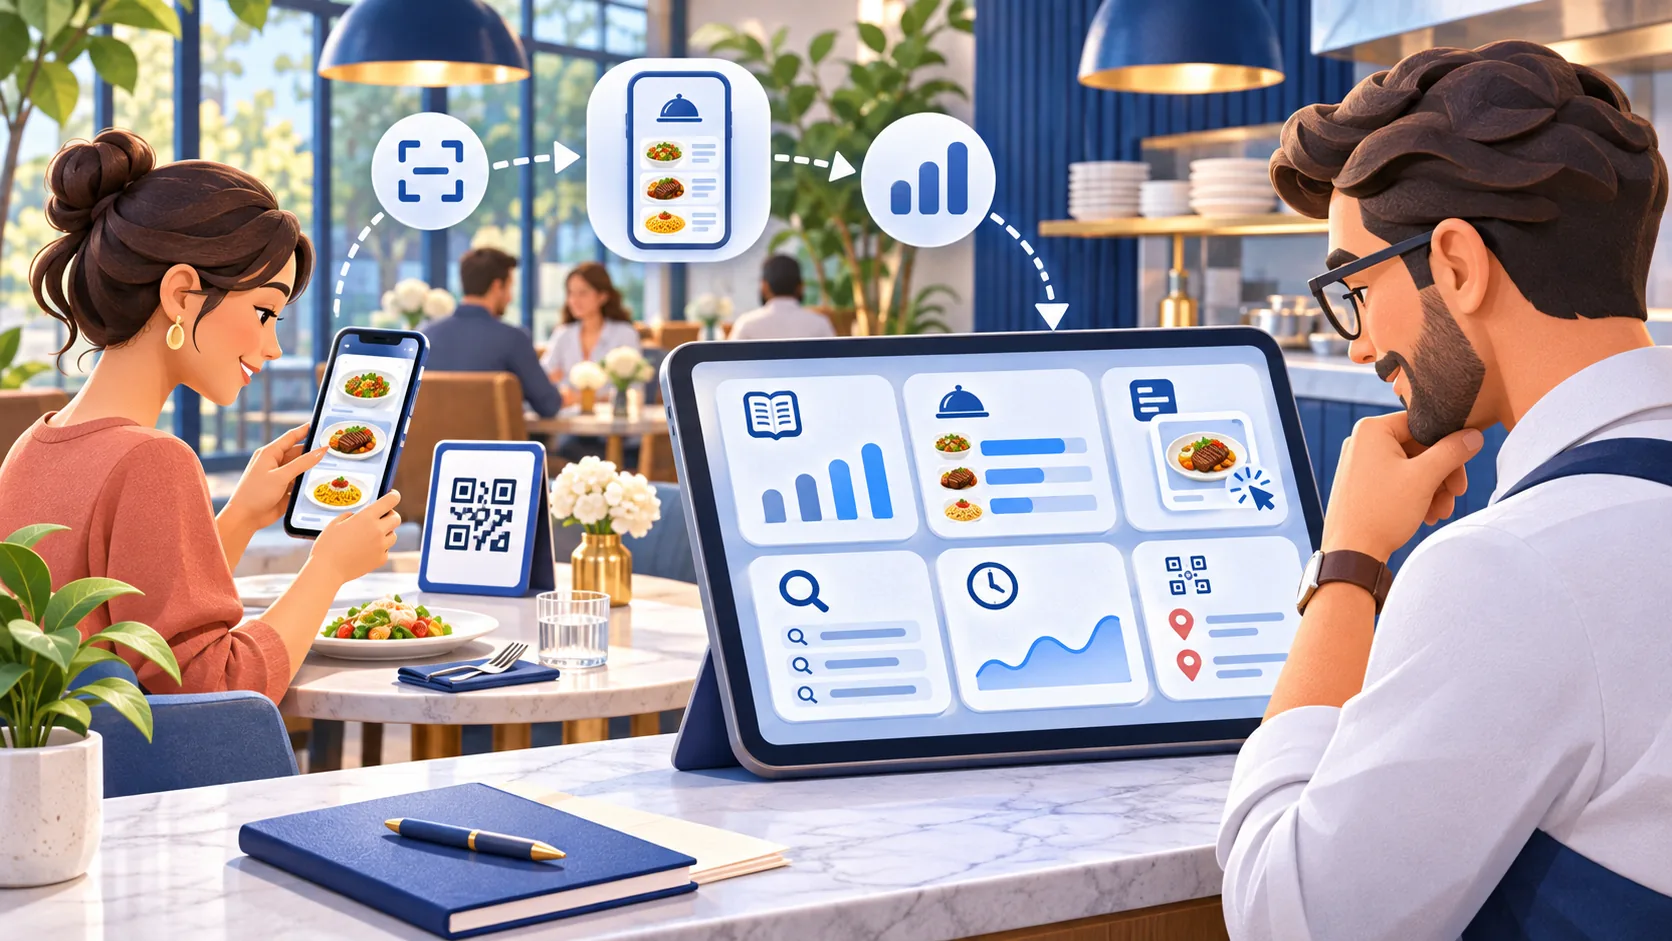
Menu analytics should answer a restaurant question
A digital menu dashboard can display visits, visible items, detail opens, searches, active time, device categories and QR placements. The difficult part is not collecting more numbers. It is choosing a restaurant question that one of those signals can reasonably help answer. A manager who begins with “Which menu cards may need clearer presentation?” has a better starting point than a manager who begins with “What does the dashboard say?”
Every metric describes a limited event. An item entering the visible screen is not the same as a diner reading its description. A detail open is not the same as an order. A menu visit is not necessarily a unique person, a seated guest or a completed meal. Useful analysis keeps those distinctions visible, then combines the digital signal with what staff know about service, availability, placement and the menu itself.
This guide explains ReviewDoctor’s restaurant menu analytics as an operational tool rather than a sales attribution system. It focuses on consented engagement with a published menu and offers a method for turning patterns into careful tests. It does not promise revenue, better rankings, more orders or a particular guest response. Those outcomes require evidence beyond a menu interaction dashboard.
Know what ReviewDoctor measures before reading the chart
ReviewDoctor’s optional menu measurement begins only after analytics permission. It records activity on a published, subscription-accessible menu rather than drafts, template previews or the fictional design demo. Global Privacy Control blocks collection in the implemented flow. A random visit identifier exists in page memory for the browsing session; it is not presented as a persistent customer identity or a count of unique people.
The dashboard offers rolling 7-, 30- and 90-day views, with dates and busiest-hour groupings calculated in UTC. Retained menu activity has a 180-day deletion rule, with cleanup when measurement events arrive, when an owner reads the dashboard and through shared cleanup. Analytics begin with new eligible visits after the feature is active; earlier guest browsing cannot be reconstructed or backfilled.
These boundaries belong in every interpretation. If consented measurement is unavailable for some visits, the dashboard is a sample of eligible engagement rather than a complete traffic census. Browser closure, network interruption, blocking software and automated or spoofed telemetry can also affect totals. Use changes as prompts for investigation, not as proof that every diner behaved in the same way.
Read menu visits as sessions, not people
A menu visit represents one measured page session created for the published menu. The same diner can open the menu more than once, and several diners can share one device. A link can also travel from a table sign into a text message or group chat. For those reasons, “120 menu visits” should be read as 120 measured sessions, not 120 guests, covers, parties or customers.
Compare visit counts over similar operating windows. A Friday-to-Sunday total should not be compared casually with a Monday-to-Wednesday total. Account for closures, holidays, weather, events, seating capacity, menu availability and whether signs were actually on the tables. The dashboard can show movement; the manager supplies the operating context that explains why movement may have occurred.
If the restaurant wants to understand covers or orders, use the appropriate point-of-sale, reservation or service records and follow the business’s approved reporting practices. ReviewDoctor menu visits are not joined to a purchase record and should not be described as a conversion count. A higher visit total can reflect more diners, more repeat openings, better sign visibility or a shared link.
Separate item visibility from detail opens
An item impression in ReviewDoctor means at least 25 percent of the menu card entered the visible screen. The browser uses visibility observation to identify that event, and each item impression is deduplicated within the measured visit. This definition is useful because it distinguishes an item that was available lower on the page from one that actually entered the viewport. It does not prove the guest read, remembered or considered the item.
A detail open records that the guest opened the item’s detail disclosure, again deduplicated per measured visit. The open rate divides detail opens by measured impressions. It can help identify cards that receive visibility but relatively little additional exploration. The rate still does not reveal why: the card may already communicate enough, the description may be unclear, the dish may be familiar, the price may shape interest, or the guest may simply be browsing another category.
Review the item card before changing the dish. Check the name, description, photo, labels, size choices, toppings and menu location. Confirm that the item was available throughout the period. Speak with front-of-house and kitchen staff about guest questions. An analytics pattern is strongest when it leads to a specific operational check rather than an immediate conclusion about popularity.
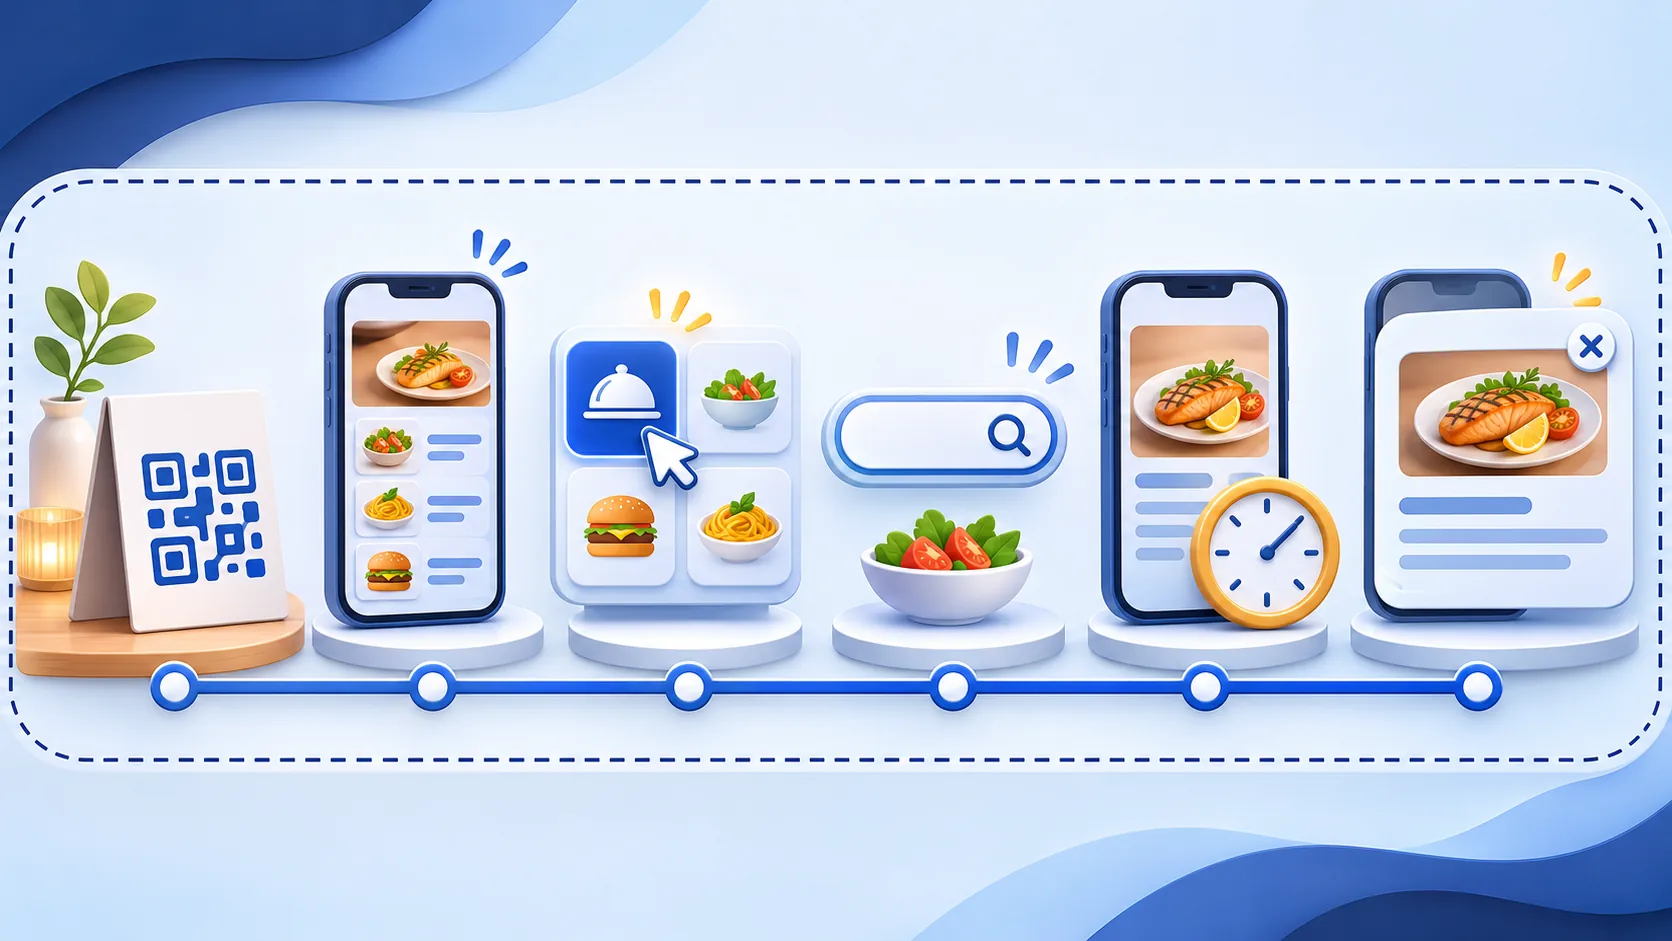
Use detail opens to improve clarity before chasing volume
A frequently opened item may be attractive, complicated or both. Diners might open it because the photo is appealing, because the name is unfamiliar, or because they need to inspect ingredients and options. Read the card alongside the data. If staff repeatedly answer the same question about portion size or toppings, the open pattern can support a clearer description. It cannot establish that the open caused an order.
ReviewDoctor’s local suggestion rule identifies items with at least ten measured impressions and an open rate below ten percent as candidates for presentation review. That threshold is a prompt, not a verdict. Ten impressions remain a small context, and a low open rate can be perfectly reasonable for a concise card. Managers should inspect the item and wait for an appropriate sample before making a disruptive change.
Prioritize corrections with low operational risk: fix an inaccurate label, make size names consistent, replace a weak crop, clarify a dietary note or move a misplaced item into the right category. Do not change several elements at once if you want to learn what happened. A new photo, rewritten name, different price and new category applied together make later interpretation difficult.
Treat search terms as guest vocabulary, with privacy limits
Menu search can reveal the words diners use to navigate, but open text also creates privacy and security concerns. ReviewDoctor retains displayed search phrases only when every word already belongs to vocabulary published in that menu, such as item names, descriptions, category names or labels. Other searches are grouped as a private search instead of storing arbitrary raw text. This keeps the report useful without turning the menu into a collection box for unexpected personal information.
Read a no-result phrase as a content question. Does the restaurant offer the item under a different name? Is the dietary label missing? Is the guest searching for a service the menu does not provide? Confirm that the phrase is part of the current published vocabulary and review the actual menu before adding synonyms. A single search is not enough to justify a new dish or dietary promise.
Distinct searches are counted once per measured visit. That avoids one person repeatedly typing the same phrase from dominating the report, but it still does not identify unique people. Search data is most useful when paired with staff observations. If several guests ask verbally for “kids menu” while the dashboard shows the same phrase, the team has two signals pointing to a navigation issue.
Interpret active time as an estimate
Average active time estimates how long the published menu remained visible and active. ReviewDoctor treats a visit as idle after 30 seconds without qualifying activity, limits accumulated active time to 30 minutes per visit and stops collection after one hour on the same page. A browser that closes before sending its latest event may leave an incomplete duration. The result is a bounded engagement estimate, not a stopwatch for the diner’s full decision process.
Longer is not automatically better. A short visit may mean the guest found a familiar item immediately. A long visit may mean thoughtful exploration, a large group sharing one phone, a difficult navigation experience or a device left open on the table. Compare time with item opens, searches, category selections and staff observations before assigning meaning.
Use time changes to create questions. If active time rises after adding detailed descriptions, check whether diners are opening those cards and whether staff receive fewer ingredient questions. If time rises while no-result searches also rise, navigation may deserve attention. The dashboard cannot decide which interpretation is correct; it helps the manager select the next place to look.
Compare categories, devices and browser languages carefully
Category selections show navigation choices, not consumption. A frequently selected category might be prominent, broad or necessary for reaching popular items. A rarely selected category may be buried, poorly named, irrelevant during the measured daypart or simply small. Check category order and item distribution before changing the offering. If a category contains one seasonal item, compare it differently from a category containing the entire dinner menu.
Device reporting uses broad categories derived from the browser user agent: mobile, tablet or desktop. That helps identify whether the mobile interface deserves special attention, but it does not identify a person or prove which device the guest usually uses. Restaurant menu design should remain responsive across supported screen sizes even when one category dominates the measured sample.
Browser language reflects a browser preference, not proof of the language a guest read or speaks. It can support a conversation about translation priorities, but it should not be treated as demographic identity. Before publishing a translation, arrange appropriate language review, keep prices and item availability synchronized, and test the complete menu rather than translating only the headings.
Understand what a labeled QR placement can and cannot show
ReviewDoctor can create distinct labeled links for locations such as patio tables, counter cards or hotel rooms, with up to 50 labels per restaurant location. Each link opens the same published menu while carrying its business-scoped placement identifier. The dashboard counts consented measured visits that arrive with a valid label. It does not count every camera scan, and a labeled link can be shared away from the physical sign.
Use names that describe the operating location, such as “Patio north tables” or “Pickup counter,” without encoding a guest identity. Keep a small sign inventory so staff know where each link is displayed. If a sign moves, update the inventory or create a new label for the new placement. An old generic menu QR code will continue to work but cannot identify its original placement.
When one placement shows fewer measured visits, inspect the physical experience first. Check lighting, glare, printing, scan distance, table clutter and whether staff remove the sign during cleaning. Confirm that the destination opens and the analytics choice appears as expected. A placement comparison is evidence about measured link entry, not proof that one dining area has less demand.
Keep photo comparisons descriptive
The dashboard can compare detail-open rates for cards with photos and cards without photos. This is a descriptive grouping. Items with photos may differ from items without photos in price, popularity, category, position, availability and description quality. The comparison cannot isolate the effect of photography and should not be reported as proof that photos caused more orders or even more detail opens.
ReviewDoctor suggests considering a photo when an item without one reaches at least five measured impressions. That rule is intentionally modest: it brings the item to a manager’s attention. Before adding an image, confirm that the dish presentation is stable and that the restaurant owns or is licensed to use the photo. Crop it for the published menu and test how it loads on a phone.
A useful photo experiment changes a small set of comparable cards and records the effective date. Keep the name, description, category and price stable during the observation window when operations allow. Compare visibility and opens, but also ask whether the image is accurate and sustainable. A visually appealing photo that does not match the served dish creates a service problem even if engagement increases.
Design a one-change menu experiment
Write the question before editing. For example: “Guests see the grilled vegetable plate, but the card may not explain what is included.” Choose one change, such as adding a concise description. Record the item, current presentation, change date, operating period and metric you will review. Also record conditions that could interfere, such as limited availability, a promotion or a holiday menu.
Choose a review window long enough to include comparable dayparts and business patterns. Do not stop the test as soon as a favorable movement appears. Look for data quality problems, confirm the published menu remained live and ask staff whether questions changed. If several operational changes happened at once, label the result inconclusive rather than inventing a clean explanation.
At the end, choose among keep, revise, restore or observe longer. State the reason in ordinary language and retain the limitations. “Detail opens increased during the observation window after the description changed” is narrower and more defensible than “The new description improved sales.” The latter would require purchase evidence and a design capable of supporting that causal claim.
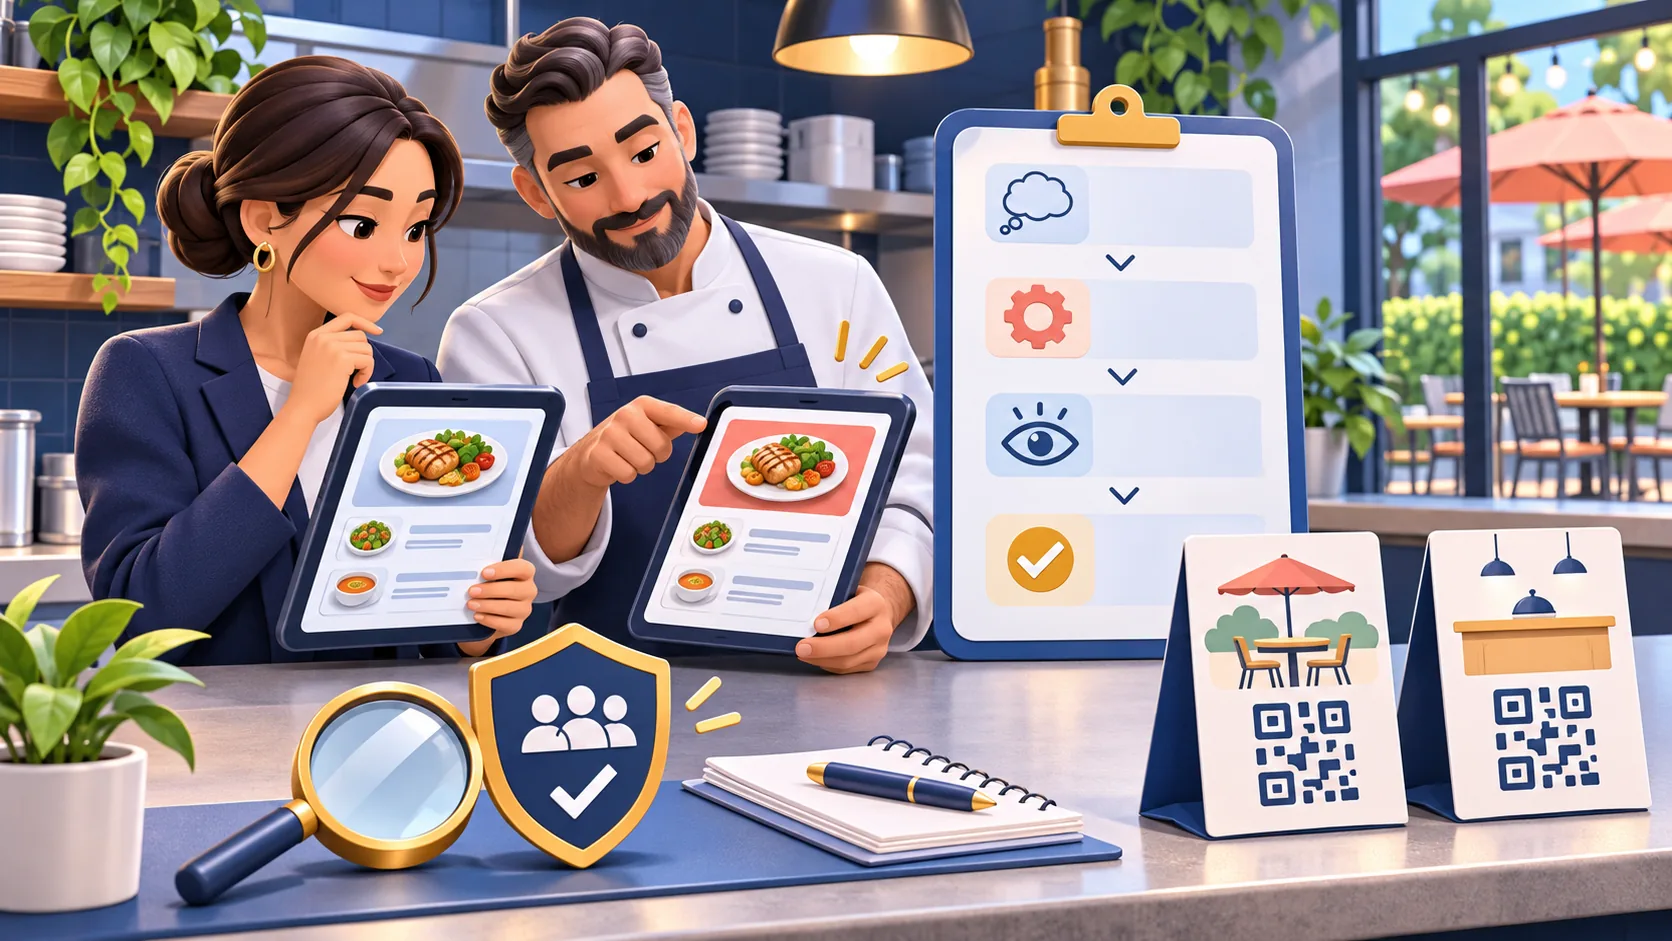
Hypothetical walkthrough: a neighborhood restaurant
Imagine a fictional neighborhood restaurant reviewing 30 days of consented menu engagement. This is not a ReviewDoctor customer case study and contains no measured results. The manager notices that a seasonal entrée entered the visible screen in many measured visits but received relatively few detail opens. Staff also report that diners ask what comes with it. The team frames a question about clarity rather than concluding that the dish is unpopular.
The restaurant verifies that the item was available throughout the planned test period, then adds one concise line describing the included sides. It keeps the item name, photo, price and category unchanged. The manager records the publication date and plans to review a comparable period, while the chef reminds staff to note whether the same question continues at tables.
The later decision will consider menu impressions, detail opens, search activity, verbal questions and operating conditions. The restaurant will not call an open an order or claim that the wording caused revenue. This hypothetical example demonstrates a disciplined process: observe a limited signal, investigate context, change one thing, and describe the result within the evidence available.
Use consent and data minimization as design requirements
The Federal Trade Commission advises businesses to keep only information they need and to think deliberately about collection, retention and access. The NIST Privacy Framework similarly treats privacy risk across the data life cycle. For menu analytics, that means defining the operational purpose, avoiding unnecessary identity and free-text collection, limiting retention, controlling owner access and explaining the measurement choice clearly.
Global Privacy Control is an important browser signal in applicable privacy contexts. The California Attorney General describes GPC as a user-enabled control that covered businesses must honor as a valid opt-out of sale or sharing. ReviewDoctor’s menu measurement blocks collection when the browser sends the GPC signal. This product behavior is a conservative technical boundary, not a legal determination about a particular restaurant or jurisdiction.
Document what the dashboard does not collect and what each report means. Train managers not to export engagement counts into customer profiles or describe the visit identifier as a person. Privacy-aware measurement is also measurement quality: a smaller set of well-defined, consented events is easier to explain and less likely to invite unsupported claims.
A monthly restaurant analytics review checklist
First, confirm the measurement context: published menu status, analytics permission, period, UTC dates, operating days, closures, menu changes and QR sign placement. Note whether a meaningful part of the experience was offline or unmeasured. Never backfill a story for activity the dashboard could not observe.
Second, read the metrics in layers. Start with measured visits and labeled QR entry. Then examine item impressions, detail opens, categories, searches, active time, device groups and browser preferences. Identify one pattern and write two or three possible explanations. Ask staff which explanations fit current operations and what can be checked directly.
Third, select one proportionate action. Correct an error immediately. For presentation questions, create a one-change experiment with an owner and review date. Verify the result in the published mobile menu and keep a short decision note. Report engagement as engagement, keep sales claims with sales evidence, and allow an inconclusive result when the data does not support a confident decision.
Better menu decisions begin with precise language
Restaurant menu analytics becomes useful when the team can say exactly what happened. A measured visit opened the menu. An item entered the visible screen. A detail card opened. A category was selected. A menu phrase was searched. A labeled link arrived from a placement. Each event is concrete, limited and actionable without pretending to describe the guest’s complete journey.
The discipline is to preserve that precision when discussing the results. Do not turn sessions into people, opens into orders, browser preferences into identity or descriptive photo comparisons into causation. Combine the digital record with menu accuracy, staff observations, availability and operating context. Then choose a small change the restaurant can evaluate honestly.
ReviewDoctor provides a consent-aware dashboard for published menu engagement, item attention, search insights, active time, device and browser summaries, photo comparisons and labeled QR placements. The restaurant supplies the operational judgment. Used together, they can reveal what deserves a closer look while keeping the claims no larger than the evidence.